As part of our recent release of the ALM Performance monitoring tool, we are offering two new charts:
an Uptime chart and a network latency chart.
We provide these charts embedded in a daily email you can get every morning right into your inbox, and it displays the availability of given hosts you’d like to monitor, including Jenkins master hosts; Jenkins nodes (slaves); ClearCase servers, ClearQuest servers and others.
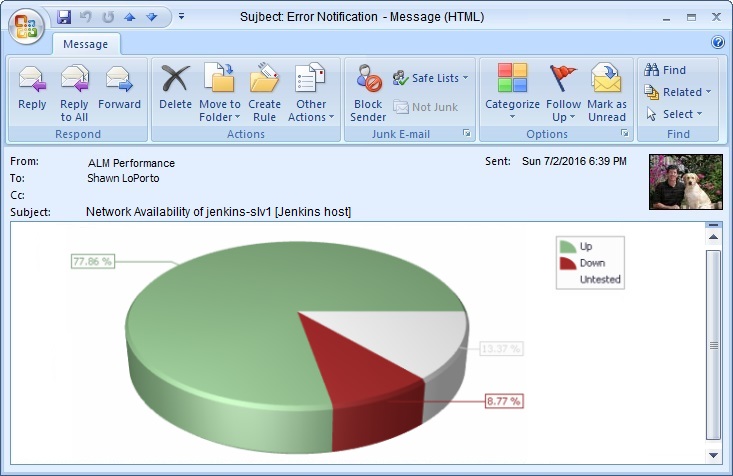
In picture: host availability Pie Chart of the past 24 hours
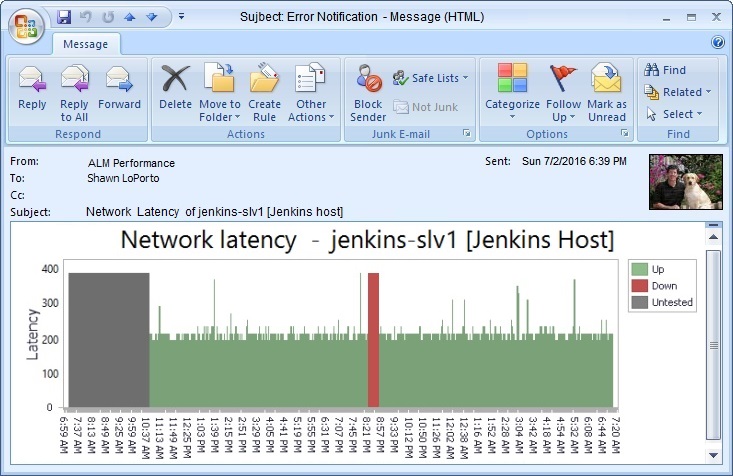
In picture: network latency bar chart of the past 24 hours (in milliseconds)
It’s very easy to install this tool – and the first chart is provided for free as part of our Free Community Edition (but you can also evaluate the full version and get them both).