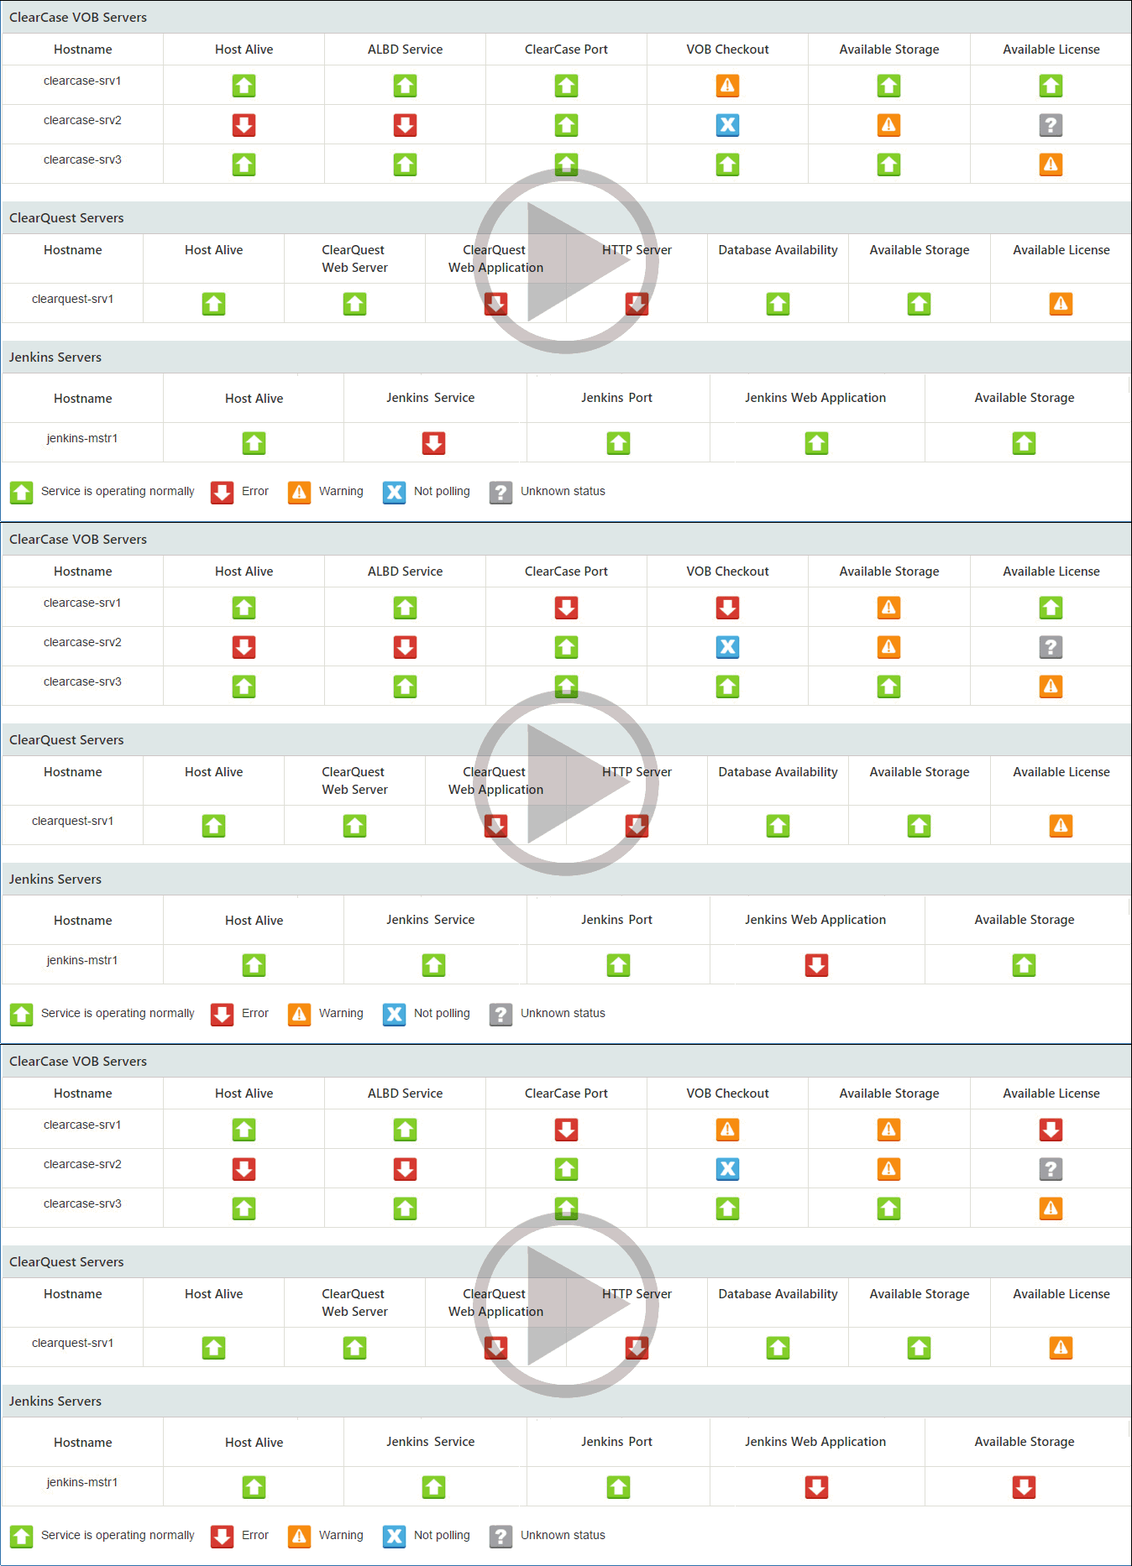
It has been 6 weeks since we released the first version of ALM Vitality, so now is a good time to share a few insights we’ve received from our ALM Vitality users. We will also share what is new in ALM Vitality and show how you can benefit from the application growth.
Here is the feedback we got from our ALM Vitality users:
- Users love the concept that ALM Vitality provides a dashboard with a single view of all the servers’ types comprising the organization’s ALM process (ClearCase, ClearQuest, Jenkins etc.) and that it covers all operating systems (all kinds of Windows, Linux and UNIX).

- Users have found it very helpful that ALM Vitality, on top of its IT monitoring, also monitors the application health from the end-user’s perspective, thus giving a better indication of your ClearCase, ClearQuest and Jenkins health and helps you troubleshoot better and more efficiently when there is an issue. For example: we monitor the Check-Out operation for ClearCase servers (for your selected VOBs); we also monitor the ClearQuest web application and your selected queries. This way we ensure that the application responds and behaves as it should, from beginning-to end.
- Users said that installing ALM Vitality is like having an internal expert in your site, comprehensively monitoring the health of your ClearCase, ClearQuest and Jenkins server 24/7 (without taking a day off).
- Users love the configurations abilities of ALM Vitality, and the simplicity of the configuration process. With ALM Vitality you can decide which monitoring tests to run and when to run them; who will get the email notifications for each server and more.

- Users appreciate the fact that a company with deep knowledge in ClearCase, ClearQuest and Jenkins developed this tool, which builds upon years of experience and accumulated knowledge, and offers support and the ability to tailor solutions to its customers’ needs.
Do you want to try this tool and see what it is all about?
Contact us by sending an email to vitality@almtoolbox.com. We will be happy to assist you with the installation and configuration of ALM Vitality.
If those reasons aren’t enough, see the up-to-date list of all IT and applicative monitoring we apply in this tool:
ClearCase servers:
- Check if the host is alive and can be reached over the network.
- Test to make sure that the ClearCase main service (ALBD) is up and running
- Test to make sure that all the needed ClearCase ports are listening and can interact with RPC calls.
- Test the ClearCase check-out command execution (on your selected VOBs), making sure your application is running as it should (and of course it applies undo checkout right after)
- Monitor the status of the server’s available storage capacity, and let you define thresholds and get notifications before you run out of space.
- Monitor your license server availability and verify the number of available licenses. ALM Vitality lets you define thresholds and get notifications before you run out of licenses.
ClearQuest servers:
- Check if the host is alive and can be reached by basic network protocol.
- Check if the web server running ClearQuest is responding correctly.
- Check if the web application running on the web-server is responding correctly.
- Check if the HTTP server is responding correctly.
- Check whether the ClearQuest database is responding.
- Check if the ClearQuest application is running correctly and responding as it should.
- Monitor the status of the server’s available storage capacity, and let you define thresholds and get notifications before you run out of space.
- Monitor your license server availability and verify the number of available licenses. ALM Vitality lets you define thresholds and get notifications before you run out of licenses.
Jenkins masters and slaves:
- Check if the host is alive and can be reached by basic network protocol.
- Test to make sure that Jenkins service \ process is up and running
- Test to make sure that all the needed ports for the web application are listening.
- Check to see whether the Jenkins web application running is responding correctly.
- Check if your JVM is running.
- Monitor the status of the server’s available storage capacity, and let you define thresholds and get notifications before you run out of space.
- Report jobs that are running more time than they should (i.e. monitor stuck jobs). You configure which jobs to monitor, and you can determine a relevant threshold for each monitored job separately.


