|
Getting your Trinity Audio player ready...
|
In recent years, SonarQube has become the de facto standard for monitoring code quality and code security in high-tech and enterprise organizations.
One of the most important metrics that SonarQube displays is Code Coverage – code coverage,
which measures how much of your executed code is actually “touched” by your automated tests.
In this article, we will explain to developers, team leads, and R&D managers:
- What is Code Coverage, and what can SonarQube do with it?
- How does SonarQube actually work with code coverage (JaCoCo, Cobertura, Coverage.py, Jest, and more)?
- What are the benefits for each role – developers, team leads, R&D managers, and DevOps?
- What code coverage capabilities are available in each SonarQube edition (Community / Developer / Enterprise)?
- Practical tips for setting up Quality Gates and coverage thresholds, including working with GitLab / GitHub / Azure DevOps.
What is Code Coverage anyway – and why should you care?
Code Coverage measures what part of your code is actually executed by unit, integration, and End-to-End tests.
It doesn’t tell you if the tests are “good”, but it does tell you whether they even touch sensitive code before you promote the code further.
SonarQube uses code coverage as a core metric in the Quality Gate –
a quality gate that decides whether a version or Merge Request is “healthy” enough to proceed further toward integration and release.
For example, you can decide not to approve a merge if the Coverage on New Code is below 80%.
Important to understand: SonarQube does not run tests – it analyzes reports
Critical point: SonarQube does not run the tests and does not calculate coverage on its own. It relies on reports that have already been generated by your standard tools:
- For Java – usually JaCoCo.
- For JavaScript / TypeScript – usually Jest / nyc / Istanbul in lcov format.
- For Python – Coverage.py (with pytest-cov, etc.).
- For .NET – Visual Studio Coverage, dotCover, OpenCover, and more.
The CI (GitLab CI, GitHub Actions, Jenkins, Azure DevOps, etc.) runs the tests and generates coverage reports; SonarScanner reads the reports, imports them into SonarQube, and displays them uniformly,
including impact on the Quality Gate and Pull/Merge Request decoration.
Which coverage metrics does SonarQube display?
Unlike tools that display only Line Coverage, SonarQube calculates a combined Coverage metric that merges line coverage and condition (branch) coverage.
Behind the scenes, it uses a formula that factors in executable lines, covered lines, conditions evaluated to true / false, and more.
The main metrics you will see on the dashboard:
- Coverage – Combined coverage percentage (lines + conditions) at the project, module, or file level.
- Lines to cover / Uncovered lines – How many lines of code should be covered, and how many of them still lack tests.
- Conditions to cover / Uncovered conditions – Coverage of branches and boolean expressions.
- Coverage on New Code – Coverage of new or modified code since the baseline according to SCM (Clean as You Code).
Coverage on New Code is the most significant metric for SonarQube – the built-in “Sonar way” Quality Gate is based on it.
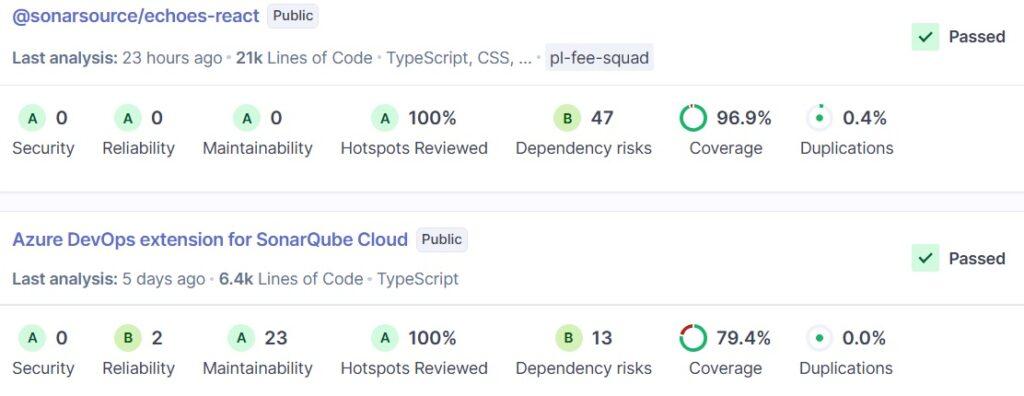
What it actually looks like: dashboards, files, and Pull Requests
SonarQube displays code coverage at several levels of detail:
- At the project level – General coverage, Coverage on New Code, trends over time, and the Leak Period (from which date “new” code is evaluated).

- At the file level – Lines highlighted as covered/uncovered, count of uncovered lines and conditions, quick navigation to problematic areas.
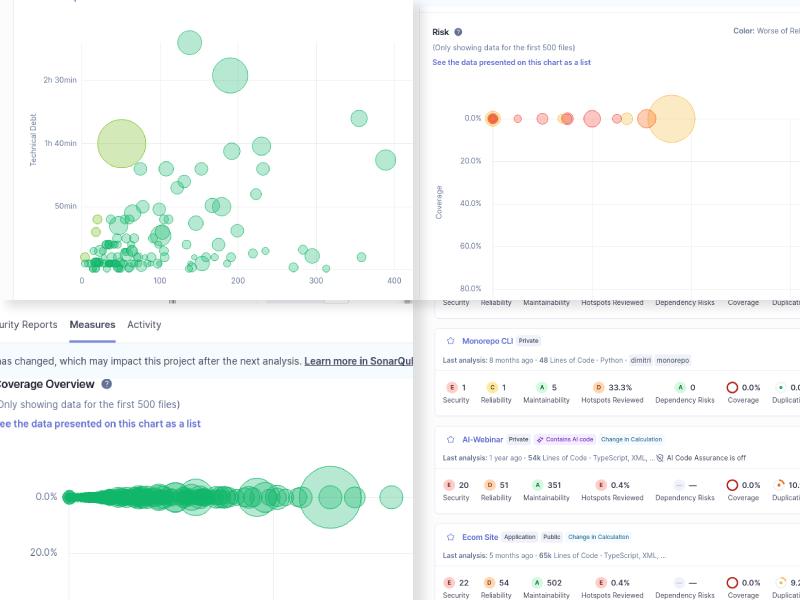
- At the Pull/Merge Request level – Coverage percentage on new code, number of uncovered lines and conditions, and the Quality Gate result (Passed / Failed) directly in the PR screen in GitLab / GitHub / Azure DevOps / Bitbucket.
If Coverage appears in the dashboard but not in the PR decoration, in most cases, this indicates a configuration issue (project binding, sonar.pullrequest.*, or report format) rather than a SonarQube limitation.
💡 A comprehensive review of SonarQube metric charts can be downloaded here.
Code Coverage by Role: Developers, Team Leads, R&D Managers
For Developers
- Easily see where tests are missing – red lines, uncovered conditions, or “red” layers and modules.
- The Quality Gate on new code ensures that if your tests do not provide sufficient coverage, the PR will be automatically rejected.
- With SonarLint / SonarQube for IDE, coverage and quality issues can be seen directly in the IDE before pushing (especially in commercial editions).
For Tech Leads / Team Leads
- Full transparency – View coverage by modules, libraries, and teams; easily identify “gaps” in automation.
- Define a unified Quality Gate for the entire team – e.g., 80–90% Coverage on new code, and 0 security vulnerabilities.
- PR decoration integrates coverage naturally into code reviews without needing to open another system.
For R&D Managers / VP Engineering / CTO
- In the Enterprise Edition, you can get a high-level status of coverage and quality across dozens and hundreds of projects using Portfolios and breakdowns by team, system, or technology.
- Code coverage becomes a real KPI – allowing you to measure quarterly trends, support struggling teams, and demonstrate long-term quality improvement.
- In organizations operating in regulated environments (fintech, medical, defense), high code coverage on new code is a basic compliance requirement.
SonarQube Editions and Code Coverage: What do you get in each edition?
The core code coverage logic is identical across all editions – SonarQube always imports external coverage reports and calculates Coverage / Coverage on New Code. The difference lies in the surrounding features:
- Community Edition – Coverage on the main branch only, without Branch Analysis and without PR decoration. Best suited for small teams or PoCs.
- Developer Edition – Full branch analysis (Branch Analysis) + PR decoration for GitLab, GitHub, Bitbucket, and Azure DevOps; this is where code coverage becomes part of the daily Merge Flow.
- Enterprise Edition – Everything in Developer, plus Portfolios, executive reporting, and advanced capabilities (Advanced Security, SBOM, etc.) that enable organization-wide visibility of coverage and quality.
For a more detailed comparison between editions – contact us (details below).
Typical Workflow: GitLab / GitHub + SonarQube + Code Coverage
In many organizations, we see a similar pipeline:
- A developer opens a branch or Merge Request in GitLab / GitHub.
- The pipeline runs tests with coverage (e.g., mvn test + JaCoCo, pytest-cov for Python, Jest for React/Node) and generates XML / lcov reports.
- A SonarScanner job runs after the tests, pointing to the reports
(e.g., sonar.javascript.lcov.reportPaths=coverage/lcov.info, sonar.python.coverage.reportPaths=coverage.xml, etc.). - SonarQube imports the reports, calculates Coverage and Coverage on New Code, and updates the Quality Gate status.
- The Quality Gate status and Coverage on New Code are written back to the PR as a status/comment. If set to Blocking, the Merge will be automatically blocked if coverage is too low.
This pattern also works exceptionally well in Self-Hosted / Air-Gapped environments – an important point for Enterprise and Security organizations.
Best Practices: How to Set Smart Thresholds for Code Coverage?
Based on our experience with clients, and also following Sonar community recommendations, it’s best to start with a pragmatic approach:
- Coverage on New Code – Set a Quality Gate threshold of 80–90% (not 100%), to avoid blocking teams on non-critical corner cases.
- Legacy Code – Do not demand high coverage on all existing code by default; focus on Clean as You Code – anything written or changed from now on must be well covered.
- Different thresholds by service type – Sometimes it makes sense to be stricter on critical services (Billing, Auth) and slightly more flexible with internal tools.
- A unified Quality Gate across the organization – but with the option to override for exceptional projects, to maintain both standards and flexibility.
What’s new in recent years around code coverage and AI?
In recent SonarQube versions (2025–2026), SonarSource is adding more languages, performance improvements, and Advanced Security/SCA, but the code coverage mechanism remains stable: importing external reports, calculating Coverage, and applying it to new code and Quality Gates.
At the same time, AI-native capabilities have been added (such as AI CodeFix, IDE integrations, and Agentic SDLC) that help fix discovered issues – but they do not replace automated tests or eliminate the need for high code coverage.
How can ALM Toolbox help you get more out of code coverage in SonarQube?
ALM Toolbox is the official distributor of SonarQube and SonarCloud, supporting organizations and startups in the setup, upgrade, and implementation of the Sonar platform – including full integration of code coverage with GitLab, GitHub, Azure DevOps, Jenkins, TeamCity, and more.
We provide:
- Consulting on choosing the right edition (Community / Developer / Enterprise / Data Center).
- Architecture and setup in On-Prem, Cloud, or isolated (Air-Gapped) environments.
- CI/CD pipeline planning with code coverage for Java, .NET, Python, JavaScript/TypeScript, Go, C++/C, and more.
- Training for development, DevOps, and AppSec teams – including Best Practices for Coverage and Quality Gates.
- Managed services (Managed SonarQube) for organizations that want “not to worry about infrastructure.”
- Assistance in choosing the appropriate licensing for SonarQube / SonarCloud and license sales.
We would be happy to help you build a Code Review and code coverage workflow that suits your team, the languages you work with, and the regulations under which you operate.
Contact us: sonarqube@almtoolbox.com or by phone: 866-503-1471 (USA / Canada) or +31 85 064 4633
Relevant Links:
- Our SonarQube webpage
- Overview of charts and graphs available from SonarQube
- Technical information about the product