Over the last few months we’ve invested a lot of time into developing brand new features, in response to feedback that we collected from our valued customers. We had the opportunity to demonstrate early releases of the new version at some events in the US, Canada and China, and we are proud to announce that the feedback has been great. So now we are making the newest version available for everyone for immediate use!
So what’s new? Here are the highlights:
1. Brand new interface that provides a legible workflow for each stakeholder
2. New queries and reports:
a) Two “Composite Baselines” report
b) Multiple Pending Change-sets report
3. New functionality that enables you to drill down even deeper and get new data and new insights from within the reports:
a) Compare the content of two versions
b) Get the difference between two versions PLUS annotate
c) Lines of Code (LoC) metrics
d) A new icon that symbolizes the merge type that was ran/done
e) Create a list of contributors and baselines involved
f) Access information from ClearQuest
4. Supporting new formats to export the reports to, fully automated
5. New charts plus a new functionality to create them automatically:
a) Lines of Code (LoC) chart per file
b) LoC chart per UCM component
6. New integration with ClearQuest
To download and try R&D Reporter V4, please contact beta@almtoolbox.com
What’s new? Now more in-depth …
- A brand new interface that enables the users to create new queries via pre-defined templates that are adaptable for all stakeholders in SW development: R&D manager; Release Manager; Team Leader, Software Engineer, QA Analyst and Information Security (Info Sec). Every user can quickly setup a new query, filtered and customized to his needs. As in previous versions, users can save the queries for future use, or even automate them as part of many development processes. Additionally, users can set static and dynamic queries.
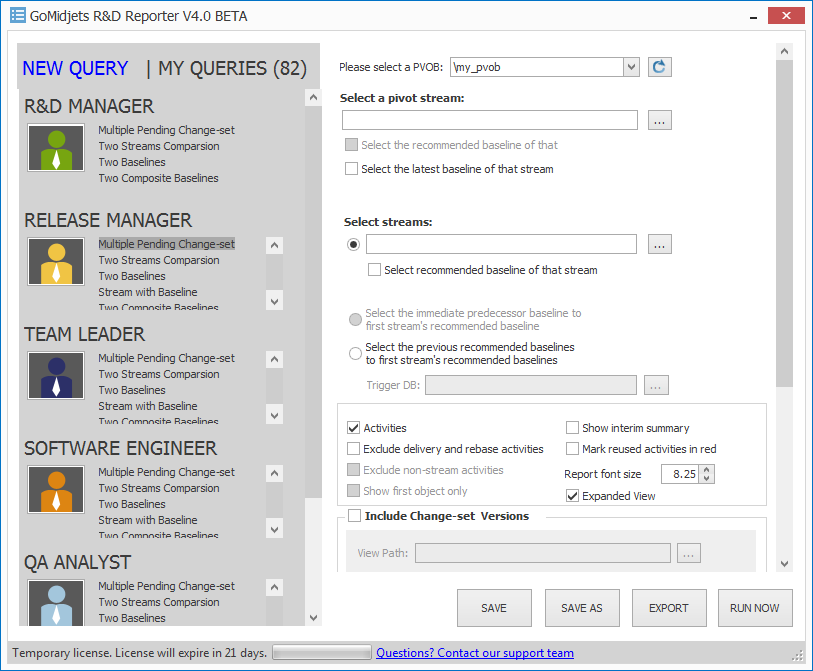
Figure 1: the new interface. New query templates are adjusted for all stakeholders in the R&D department.
2. New queries and reports:
We now provide two new query types:
a) Two “Composite Baselines” report:
This report displays the difference for all components in a composite baseline, grouped by components.
The report provides the filenames and the version for each baseline.
The report also provides metrics for the differences between the composite baselines: how many files have been added, removed and changed and how many files have not been changed (kept identical).
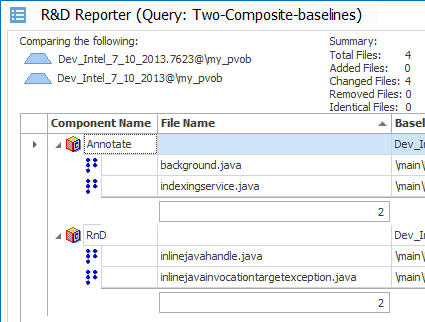
Figure 2: The report displays the names of compared baselines and a metrics summary for the differences between the baselines: how many files have been changed, how many new files have been created, how many have been changed and how many removed. For each component, you receive a list of all changed files inside, including their properties, the baseline versions for each composite baseline and the file versions for each file and baseline combination.
You can also drill down and compare the content that was changed between the two versions, see the history and get annotated data by running Visual Annotate from within the context menu.
You can also utilize a new 3 “Lines of Code” (LoC) columns that count how many code lines have been added, changed and deleted between the versions of two baselines!
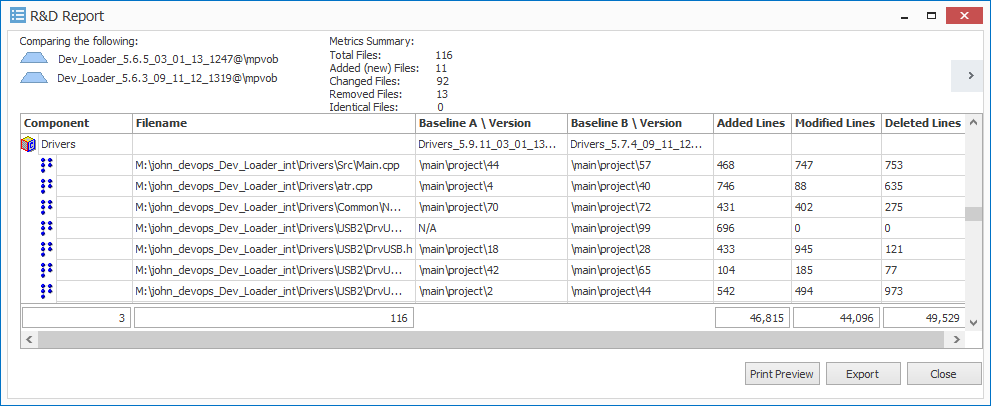
Figure 3: the three columns at the far right represent “Lines of Code” (LoC) metrics for each file that was changed between the cut of the two baselines. It displays how many code lines have been added, changed or removed.
This is a smart feature that can filter out the blank links and comment lines for dozens of code languages. It calculates the differences between real code-lines only.
As in previous versions, you can quickly setup a dynamic query that takes the latest composite baseline and compares it with the previous one, or take the latest by a naming convention you provide and compare it with the previous one (with the same naming convention).
b) “Multiple Pending Change-sets” Report
This report enables you to compare a central (a “pivot”) stream with multiple streams and get all of the results in one report! For instance, you can compare an integration stream with all of its child streams. This helps you to quickly identify which activities have not been delivered yet to the integration stream – which probably means that they are currently in development.
To watch a demonstration click here:[Link]
This also applies for comparing streams from within different UCM projects. This way you can even compare ClearCase projects.
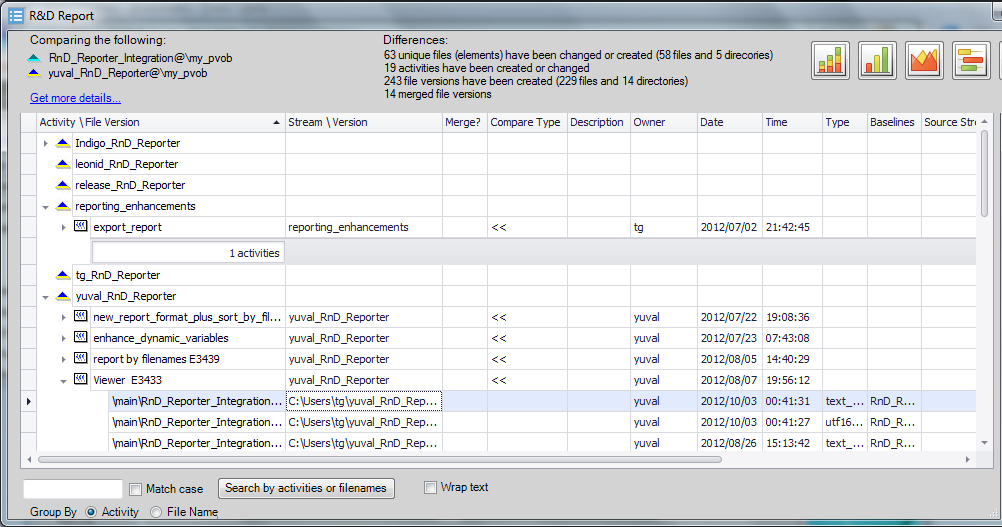
Figure 4: In this example we compare an integration stream, “RnD_Reporter_Integration”, with 6 child streams: “Indigo_RnD_Reporter”, “leonid_RnD_Reporter” etc. You can easily see activities which have not yet been delivered to integration stream (activities: “export report”, “new_report_format” etc.), as well as filenames which are part of those undelivered activities. You can also see streams that have nothing to deliver (e.g. “release_RnD_Reporter”).
3. A new functionality that enables you to drill down even deeperthan ever and get new data and insights from within the reports.
a) Now you can drill down and compare the content of two versions for each file that was changed, directly from within the context menu. R&D Reporter automatically identifies the two versions involved and opens a Diff tool (the one you defined in your ClearCase definitions). This is especially valuable to developers and leaders and is helpful for code review and for quickly pinpointing the root causes or reasons for bugs.
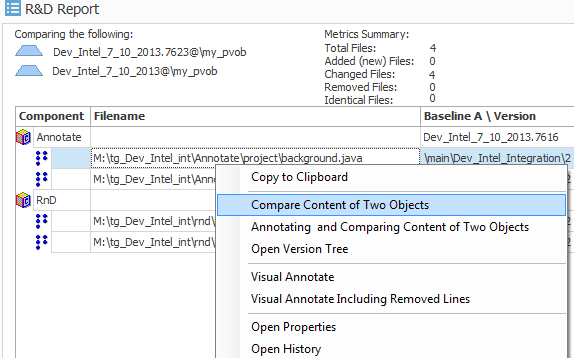
Figure 5: comparing the content of a Java file (background.java) that was changed between two composite baselines.
b. Furthermore, you can drill down even more and get the difference of two versions PLUSannotate the first version (by Visual Annotate which is part of the tool now). This way you can get a comparison, as well as more information for each code line: who inserted it, when it was checked, in which version, in which activity and more. This helps you to investigate your code even if it’s a legacy code that you didn’t create yourself.
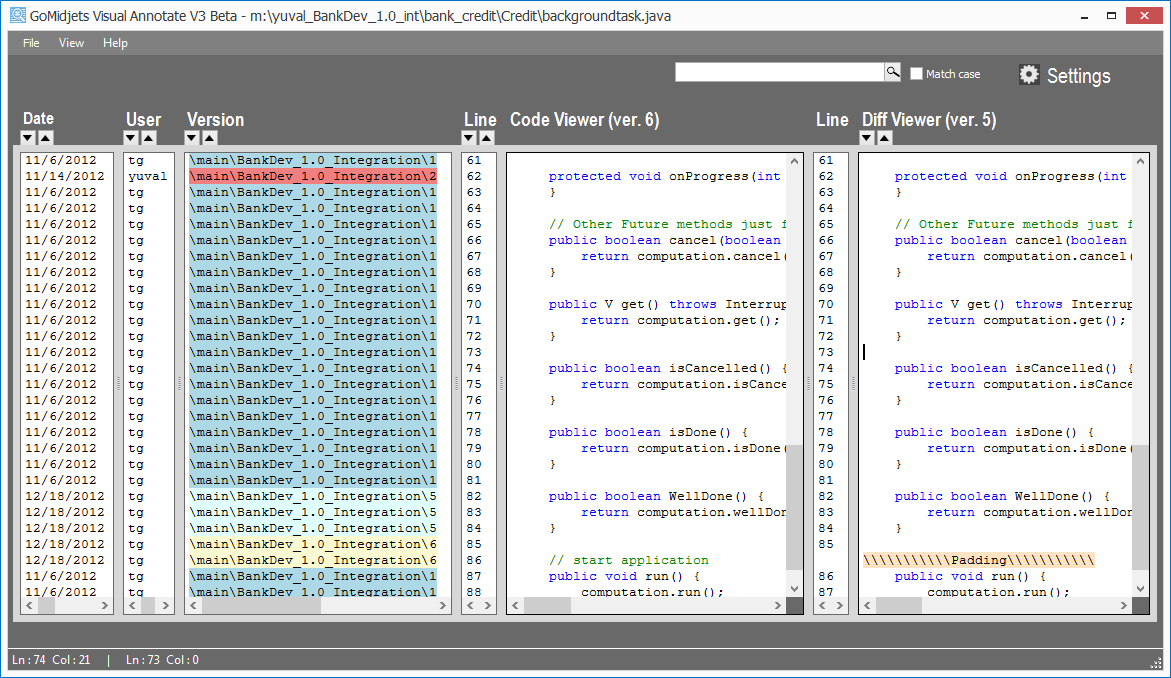
Figure 6: Annotate and ‘Diff’ in one screen, for a better root cause analysis. The “Code Viewer” column is the pivot (it displays version 6). You can see the annotated data on the left side of the code viewer; on the right side you can see the compared data (version 5).
c. we also developed a new functionality for R&D and QA managers: Lines of Code (LoC) metrics. For each code file, we measure the amount of code lines that have been added, removed and changed. You can also get a summary that calculates all of the files (in a given report) together.
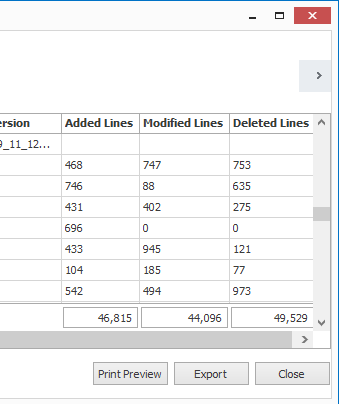
Figure 7: Lines of Code (LoC) metrics. For each source file, it measures the amount of added, modified and deleted lines.
d) New icon that symbolizes the merge type that was done
In previous versions R&D Reporter displayed a yellow merge icon for each file version that was created by a merge operation.
Now, there are new two icons that can be displayed together with the merge icon: Equal and not-equal icons. = =
These icons tell you if the content of the source and target file versions of a merge are identical or not.
If it’s equal, it means that a “copy merge” operation was done.
If it’s not-equal, it means that a trivial or non-trivial merge was done.
This information is useful for developers, release managers and team leaders. It helps them to quickly identify and notice problems even before the release or deployment of a new version: they can quickly watch the list of files together with those icons and discover a file that a not-equal icon when it should have been merged as a copy-merge (which is a problem in merge) and vice versa.
Figure 8: new equal and not-equal icons that help to learn about the content of the merged file versions.
At your convenience, you can also view this information in a centric view when you group a report by UCM activities:
In most cases (depending on how you utilize ClearCase), “deliver” and “rebase” activities contain all file versions that were created by a merge operation.
e) You can drill down from within the report and get additional metrics of the content that was changed between two objects you run a comparison (two baselines, two streams etc.):
- A list of contributors, including the amount of check-in files and activities
- A list of baselines that were made in the scope between the two objects compared
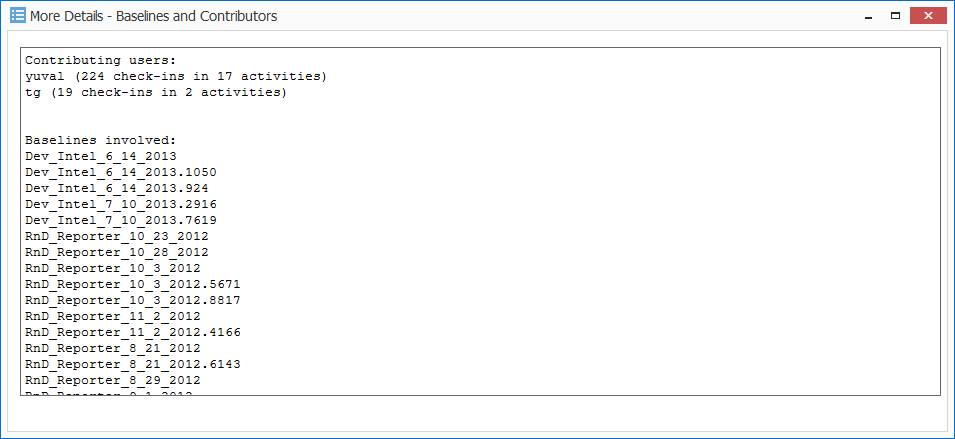
Figure 10: Drill down and see who the contributors are, what they have contributed and what baselines have been made in the scope between the compared objects.
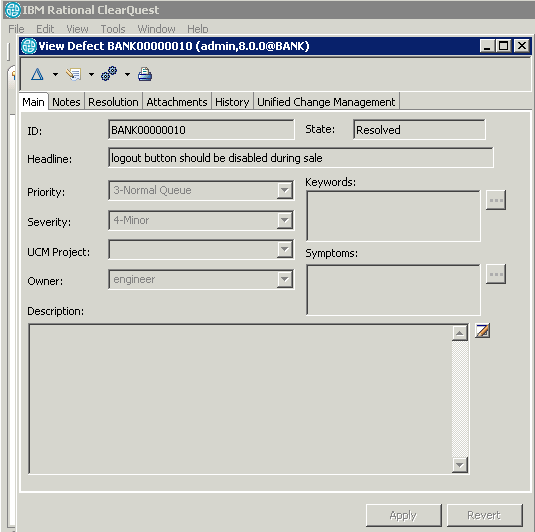
f) ClearQuest: If you work with ClearQuest UCM enabled, you can get more info from connected ClearQuest records. Please see chapter 6 below for further details.
4. Supporting new formats for export the reports, fully automated
We extended the export capabilities. Now you can export all kinds of reports in any situation of filter and sorting that you choose; you can fully automate the exporting process. Finally – there are now even more formats we support with the export. Besides CSV, HTML and our unique Rich Report format, you can export to
- XLS (Excel 97-2003); XLSX (Office 2007 – 2013)
- RTF (Rich Text that is supported by MS-Word)
- Text
- MHTML (Mime HTML)
- Image files (JPG, PNG and Tiff).
This variety of formats enables you to use the reports for many activities, such as Release Notes documents, a status report to be delivered to R&D managers, a list of delivered activities to test for QA analyst, etc. As you can see, there are also portable formats that you can deliver to non-Windows systems, such as UNIX, Linux and mobile devices.
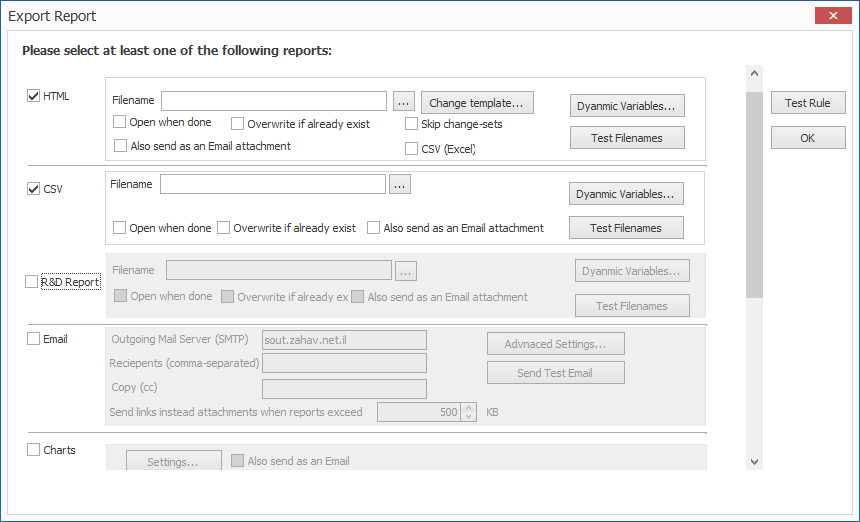
Figure 11: Settings form of exporting reports. You can save these properties as part of the queries. This helps you to apply automatic export into reports and charts.
5. New charts plus a new functionality to create them automatically
As we now provide LoC metrics (see above), we also developed a graphic representation that completes it:
a) Manhattan bar chart that displays the added, changed and deleted code lines per file. You can display it in two modes: accumulated (one bar for each file) or stacked (3 bars for each file)
b) LoC chart per UCM component. This chart is part of the new “Two Composite baselines” report. When you compare two composite baselines, you get the differences for each component. We developed a new chart that completes the new report and demonstrates how many code lines have been added, removed and changed in total for each component. This enables you to see the maturity of the code in the relevant component (a component with fewer a few changes is considered to be more mature and stable).
You can export those charts into graphic files and create them automatically whenever you need.
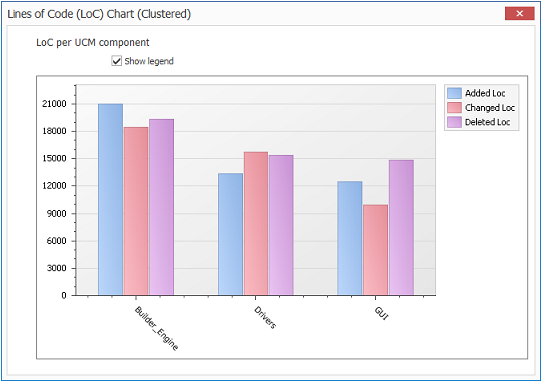
Figure 13: Lines of Code (LoC) chart per component. There are 3 components: Builder_Engine, Drivers and GUI. For each one, you can see how many code lines have been added, changed and deleted.
6. New integration with ClearQuest
We extended the integration with ClearQuest in case you work with ClearCase and ClearQuest UCM enabled mode.
Now you can add another two fields for the queries and reports:
- ClearQuest ID (this field provides the linkage between a ClearQuest record and a CC UCM activity)
- ClearQuest Record Type
When you hover on activities in the reports, you can right click and get the Properties window of ClearQuest.
Those new features enable you to get more traceability and more collaboration between your SCM and change-management tools, as well as the relevant processes and stakeholders.
In the upcoming year we will enhance this functionality and provide more integration points with other bug trackers. If you need a specific integration, please let us know (beta@almtoolbox.com)

